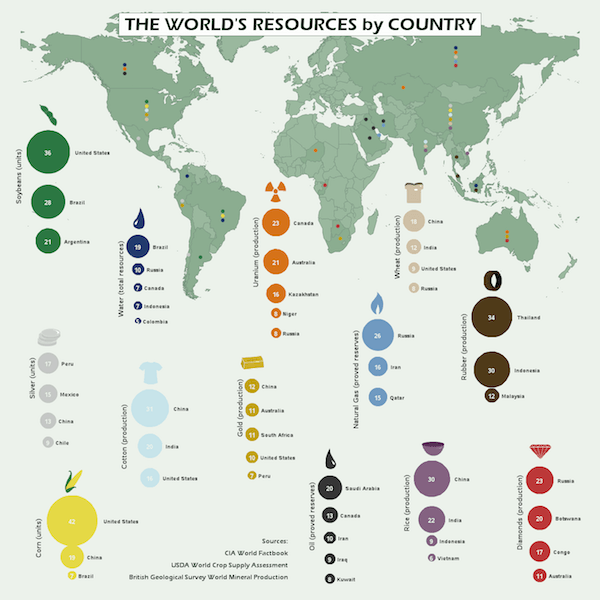
Here is a great depiction of the world resources infographic.
As you go through the data visualization below, there are several statistics that will have you questioning your knowledge of the world’s resources by country.
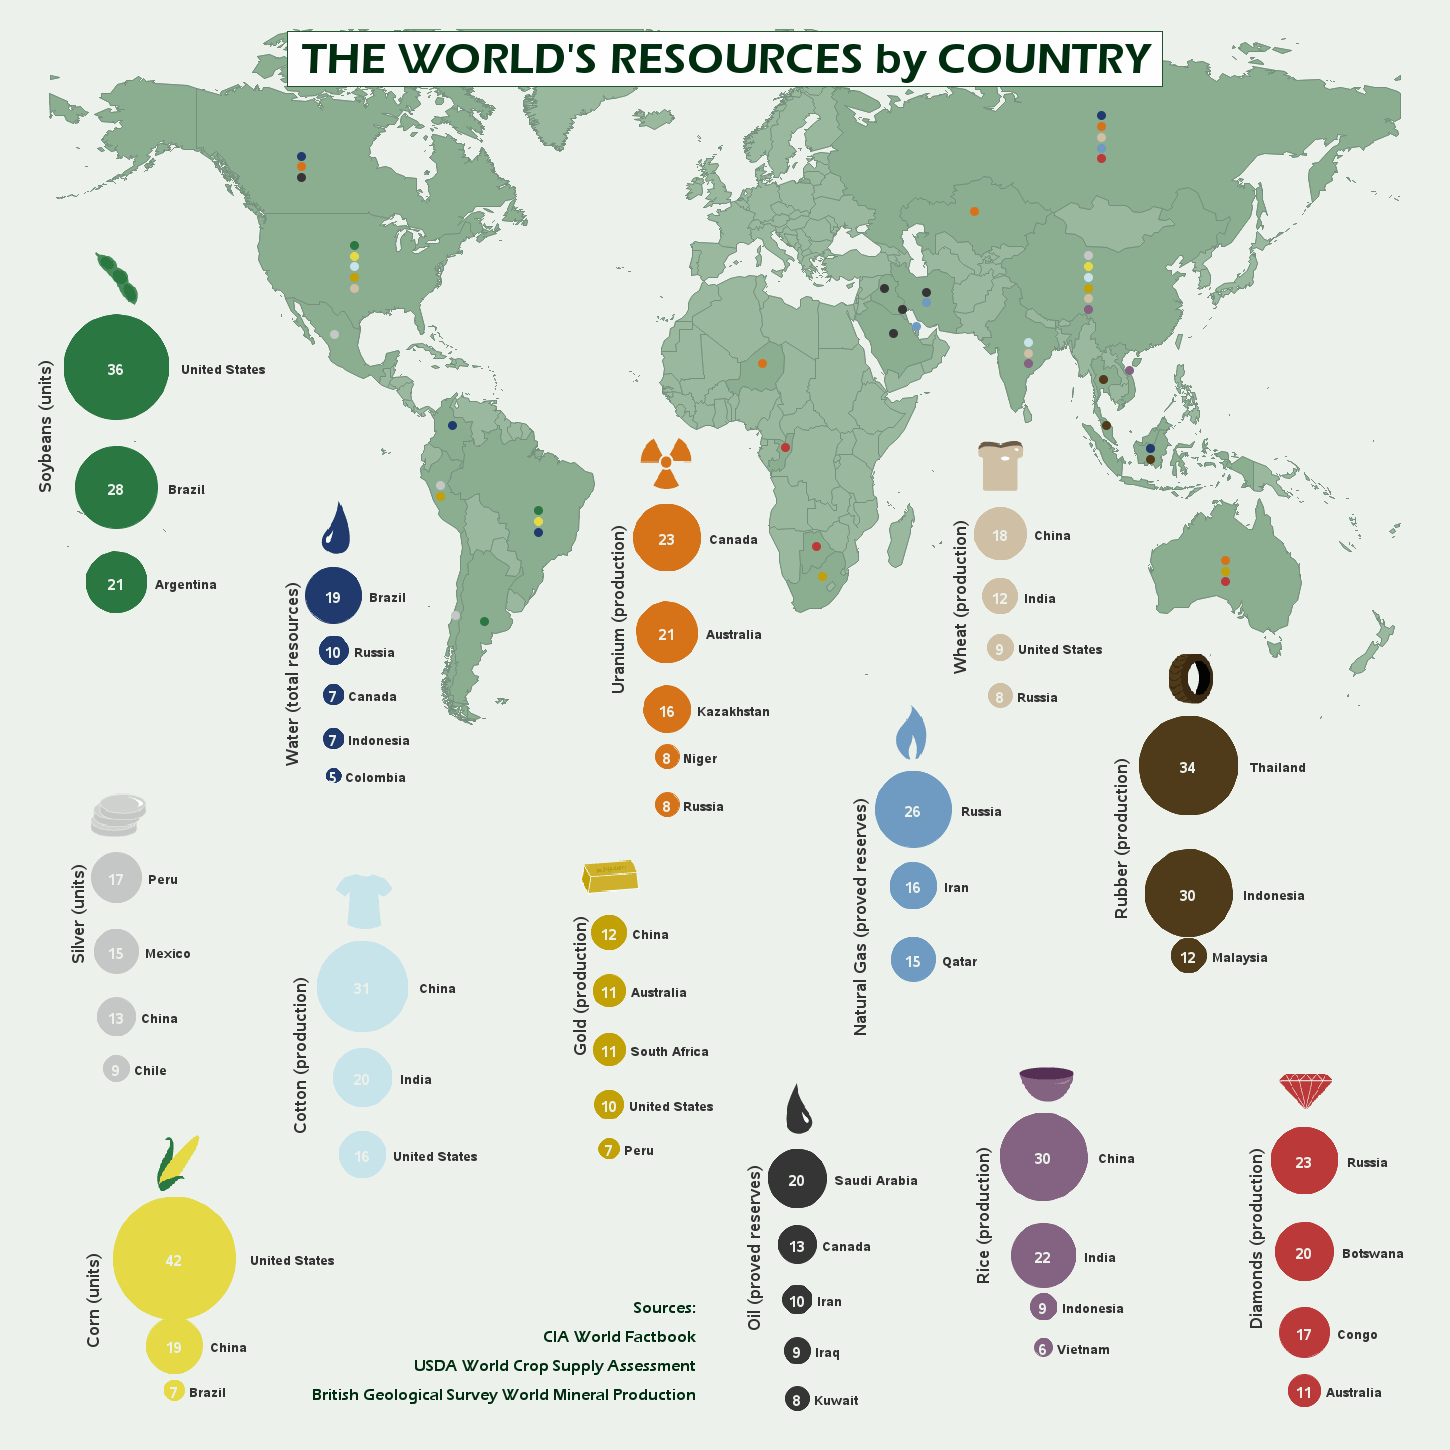
There are a few facts that stand out to me in this infographic.
- The United States is third in wheat production. If you have ever driven through the midwest, you no doubt have seen fields of wheat for miles and miles. It is hard to believe that China and India grow more wheat than the United States. Although those countries have a lot more people to feed, so one can assume that is the case.
- The United States is not even in the top 5 world resources for water. Again, I find this incredible when you look at the amount of water we have in the US. Think about the great lakes and all of the lakes across the country and yet we are not even on the map for water resources.
- I am very surprised that tea is not included in the world resources because it has such a large impact on life in the orient and elsewhere. I am sure that China would lead the world resources for tea, both black tea and green tea. I also think that Japan would nudge china out of the top spot for matcha green tea.
- The United States is fourth in gold production. I had no idea that we were still mining gold in the US. I would love to know where in the US gold mining is taking place and if there is still the possibility of the little guy getting in on this and getting a piece of a modern day gold rush.
For the most part, the rest of the world resources are pretty much as you would expect.
Return To Awesome Infographics Home Page