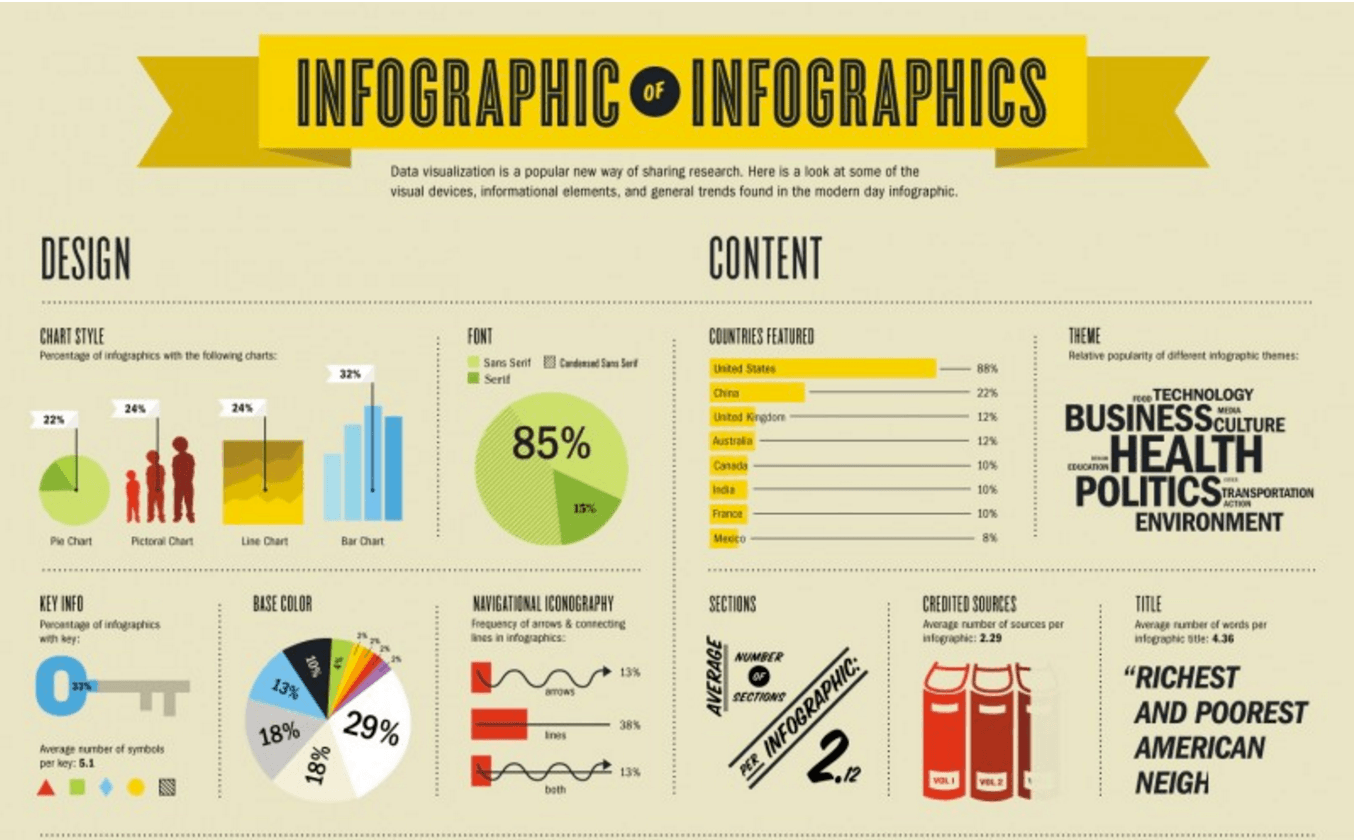
As infographics become more and more popular, we thought it was only fitting to publish an infographic on infographics!
The infographic below is a typical example of the type of content and statistics that are usually included in this type of visual content.
As you can see, it is commonplace to use different types of charts to illustrate your data.
Strangely, according to this infographic, most use the same font, with 85% using Sans Serif or Condensed Sans serif.
The average number of credited sources is 2.39 and the average title contains 4.36 words.
Infographics are a great way to illustrate statistics.
Data visualization is a great way to share research through visual devices, informational elements and general trends.
Infographics have become a popular way for bloggers and website owners to build backlinks and get social shares in order to show the search engines their relevance.
The best way to use an infographic to build backlinks is first and foremost by having a high quality infographic that people are going to want to share.
I’m not sure that this one fits the bill in that regard.
While it contains some good information, it really isn’t presented in a visually pleasing format.
It also is quite short for an infographic of any real value.
So while it is an infographic on infographics, I feel that we should create another infographic on infographics that goes into much more detail and more aesthetically pleasing.
Once you have a high quality infographic, you should submit it to every free infographic submission site that you can find.
Bear in mind that every infographic submission site is going to require a unique description of at least 300 words and the longer the better for getting your infographic published for free.
That’s why we offer our infographic content creation service here at Awesome Infographics. It makes it very easy for bloggers and webmasters to get their infographic published without having to worry about creating unique content.

